
This article represents the opinions of the Oredigger’s editorial board after analyzing the data from the sex survey we sent out on February 4th, 2015. If you’re interested in getting your hands on the raw data (no pun intended) keep reading this page and take our poll at the bottom!
What is the sex survey?
Last week, the Oredigger sent out an email to graduate and undergraduate students asking them to take a survey that was all about sex. The survey asked students a series of questions ranging from topics like number of sexual partners to the number of times per week students talk to their parents. A lot of people participated, 3446 to be exact, though that includes a sizable number of responses from some internet trolls. We recommend you read our editor-in-chief’s article on the front page to give these results some context.
We asked participants around thirty questions, so there was a plethora of data to sort through. This is only the beginning of our analysis. We wanted to do a really good job analyzing the results, so we decided to spread our analysis across multiple issues. This week we focused on gender and GPA even then we had to cut out data due to space limitations.
We know this might be frustrating, but we spent nearly twenty hours on analysis this weekend and we barely scratched the surface. We do feel bad for delaying the results though, so we have decided to release the raw data…sort of. See below for more information.
The data is pretty bad, right?
The answer here is pretty obvious: our results would not get published in an academic journal. Having said that, the demographic distribution of the responses we considered in our analysis is fairly consistent with what the school actually reports. For instance, according to our school’s enrollment data, which can be found on the institutional research page of inside.mines.edu, approximately 60 percent of enrolled students at Mines are Colorado residents. On the survey we asked students to identify themselves as in-state or out-of-state and 60 percent of individuals who responded to this question indicated they were in-state students.
Our results also aligned with the expected distribution of majors, shown in Figure 4. We pulled this information from the Career Center’s website and it only represents the graduating class, but it was the best we could find. As shown by the figure, our results align decently with the expected results, indicating the data has some degree of reliability.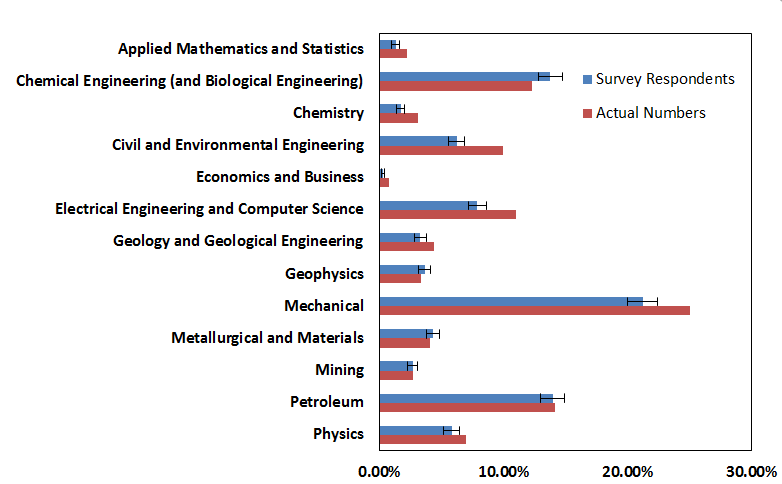
Figure 4: The distribution of survey respondents by major department compared with the distribution of the 2013-2014 graduating class. We pulled this information from the Career Center’s website and it only represents the graduating class
The survey data gets a bit more skewed in the gender department, where 63.5 percent of individuals identified as male, 35.3 percent as female and 1.2 percent as other. The school reports that only 27 percent of enrolled students are female.
There were also some other interesting holistic observations. For instance, the average GPAs for undergraduate men and women who took the survey were equal at 3.170 and 3.165, respectively. We were never able to track down an official statement or document from Mines stating what the average GPA is now, but we did find an article from Mines Magazine published in the spring of 2010 that reported an average female GPA of 3.0 versus an average male GPA of 2.9.
Next, while only 13 percent of survey respondents identified as graduate students, the remainder were evenly split with roughly 22 percent identifying in each of the class categories (freshmen, sophomores, juniors, seniors). We were unable to find a breakdown of class sizes at Mines, but we did find out from the most recent Integrated Postsecondary Education Data System (IPEDS) report, that approximately 20 percent of students at Mines are graduate students and approximately 22 percent of the 2013-2014 student body was composed of first-time degree/certificate-seeking undergraduates, or in other words freshmen.
While graduate students were underrepresented in our survey, their effect on the data was significant. Figure 5 shows the distribution of GPAs across classes. We rounded all GPAs to the nearest half and we did not include individuals who reported GPAs above 4.0 in our calculations.
Additionally, graduate students reported much higher GPAs and were initially skewing our results (see Figure 5). We felt it was important to remove graduate students from most of the analysis. Additionally, graduate and undergraduate students experience vastly different sides of Mines, so grouping their responses together is problematic. If you are a graduate student who answered the survey, calm down. We will conduct an independent analysis of graduate students in future issues. We just want to make sure we are representing the data in the most accurate way possible.
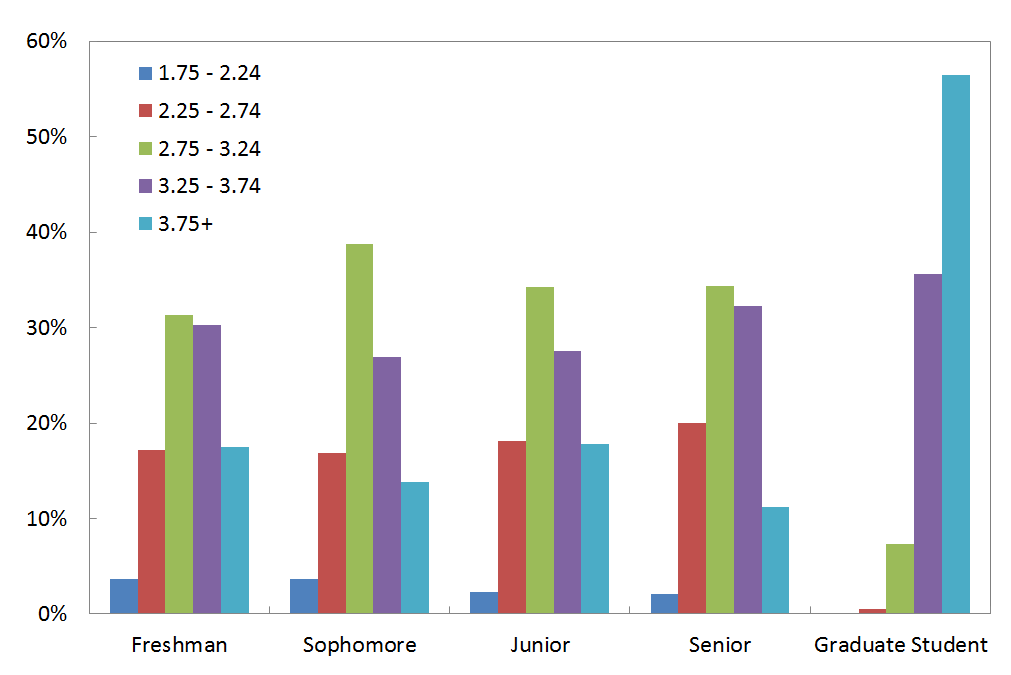
Figure 5: The distribution of survey respondents by year and GPA rounded to the nearest 0.5. Graduate student GPA’s do not follow the same distribution patterns as undergraduate GPA’s. Graduate student data was not considered in this publication.
Table 3 shows how our results compare with national averages and indicates that either Mines has a slightly more sexually active campus, or our results are biased.The higher percentage of female respondents indicates that there is probably some degree of bias in our results, though it is difficult to pinpoint exactly what the bias is.
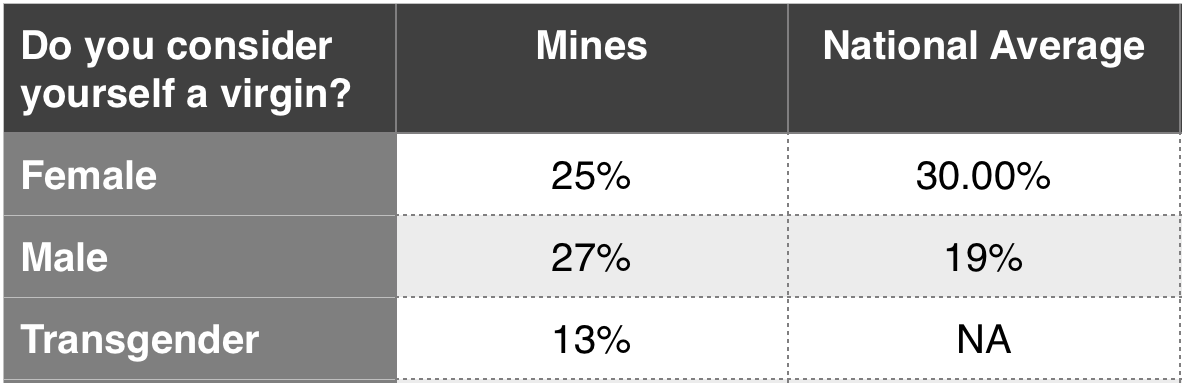
Table 3: The percentage of male, female, and transgender individuals who identify as virgins compared to a national average published by the American College Health Association in Spring 2014.
There’s also the issue of “joke responses.” We’ve already explained how we eliminated certain answers, but this was obviously not fool-proof. Not everyone who lies does so in obvious ways. This seems to be an issue of classifying the survey results. If we wanted to be more accurate, we would clarify that all of our generalizations are based on reported answers and may not actually align with reality. This is a distinction we feel is meaningless and rather obvious, but it is worth pointing out nonetheless.
If we could summarize our feelings about the reliability of the survey in one word it would be “meh.” The results are not accurate, but they are not necessarily inaccurate either. Use them at your own peril.
I heard the survey was posted on 4chan and reddit. Doesn’t that mean the results are meaningless?
This answer is multifaceted. On the one hand, the fact that approximately 1300 individuals on the internet took time out of their days to corrupt the results of a survey that was in no way associated with them has forced us to reconsider our implicit assumption that people are primarily good. On the other hand, we have time-stamps, so trying to explain the motivations of “internet people” is entirely unnecessary.
Our process here was pretty straightforward. On Thursday night, there were approximately 1900 responses. By Friday morning, this number had spiked to 3300. While we would love to believe that roughly 66 percent of the student body had responded to our survey, this just seemed too good to be true. Some people also told us it had been posted on 4chan. It was also pretty obvious in the data. At end of the day on Thursday, only 1.5 percent of survey respondents selected “other” as their sexual orientation. By Friday morning, this number had jumped to 22 percent. Reading the sexual orientations spewed forth by 4chan and reddit users was not altogether disappointing. Our favorites include “extreme apathy,” “cheese,” and “20000sexual.”
We decided to do the responsible thing and remove all responses after a certain point in time, reducing our sample size to roughly 1500. If you responded after this point, we are terribly sorry that your voice was not heard. Blame the internet.
Even after removing these responses, there were a few answers that just did not seem reasonable. We used a three-strikes method to identify unreliable respondents. For instance, if you claimed to be a freshman majoring in Liberal Arts and International Studies who has had sex in Edgar Mine, we definitely rejected your response. This process led to the removal of 40 out of 1500 responses, which is not too bad if you ask us.
Can you release the raw data to the community?
First of all, we want you to know how badly we wish we could simply say “yes” and have that be it. We feel very little ownership for this data and we feel obligated to release as much as we possibly can. Unfortunately, there are a few legal and ethical concerns. The survey was confidential, but we did ask a fair number of demographic based questions and as a result, it may be possible to identify an individual in certain situations. We wish we could trust you not to exploit the data for this type of goal, but then we remember that amongst all of you is someone who posted our survey to 4chan…
But we really want to give you the data so we are going to post as much as we can without jeopardizing anyone anonymity. In a few days, we will post an excel spreadsheet with the responses, but we have been asked to exclude the identifying questions we asked including gender, major department, class year, residency status, sexual orientation, relationship status, and GPA. We think we can reasonably include one of these categories and still maintain an acceptable level of confidentiality and we want to know which one people want the most. Vote for the category you think we should release in the poll below. We cannot promise that we will end up releasing the data from the winning category, but we promise we will do our best to get you as much data as we reasonably can. The only other data that will be removed is the comments, for obvious reasons.
In exchange for releasing the data, we only ask that you try to think a little bit more about the data than a typical 4chan user would. Maybe go back and actually read the article on the front page. We think Mines students are pretty intelligent and we are confident some of you are better at statistical analysis than we are. Please do not let us down and instead show us that releasing data to the public is not just an issue of principles, but also key to generating better analysis. If you come up with something cool, let us know and we will probably publish it.

'Sex Survey: We’re going to try to answer your questions…' has no comments
Be the first to comment this post!